Online infographic marketing has become a great way to publish content in a fashion that is easily accepted and digestible by the community. And with the availability of free online tools, one no longer has to be an artist or designer to create stunning information graphics.
This post features 10 free tools that will will assist you in your information graphic design efforts.
Creately is a visual collaboration platform that allows users to easily create diagrams and flow charts and can be used by project teams to communicate more effectively. Choose from a number of purpose-designed diagram types and quickly add your data to make your own chart.
Google Public Data Explorer makes large datasets easy to explore, visualize and communicate. Students, journalists, policy makers and everyone else can play with the tool to create visualizations of public data, link to them, or embed them in their own webpages. Embedded charts and links can update automatically so you’re always sharing the latest available data.
Hohli is an intuitive but simple online chart maker. Select a chart type, add your data, vary the colors and sizes and out comes a finished chart. The charts are very well designed and will work fantastically in your information graphics.

Many Eyes is an experiment by IBM Research and the IBM Cognos software grouplets where users you upload their own data or can utilize data already stored on the site. Visualizations are well-designed as well as professional-looking and will work well in infographic designs

StatPlanet is a free application that allows users to create thematic maps and graphs. Explore demographic, environment, health, education and socio-economic indicators from various sources such as UIS and WHO. It also has the capabilities to produce customized interactive maps and graphs by adding or importing your own data. You can then turn them into static images which can be used infographics. Use the application online or as a stand-alone desktop application.
Visual.ly helps you create beautiful visualizations in minutes and instantly apply the graphics genius of the world’s top information designers to your designs. Plug and play, then grab and go with our push-button approach to visualization creation.
![]()
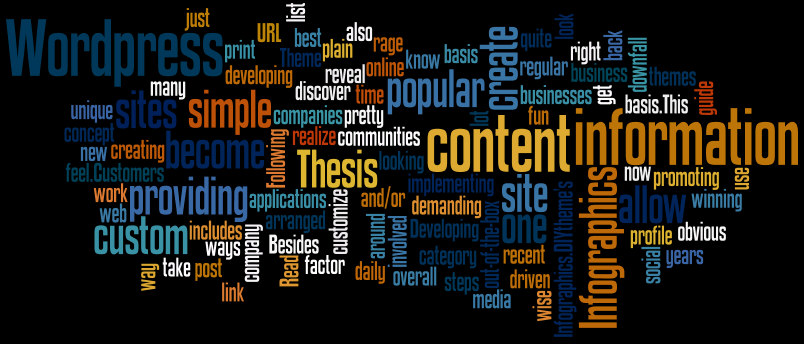
Wordle is an application for generating “word clouds” from text that you provide. The clouds give greater prominence to words that appear more frequently in the source text. You can tweak your clouds with different fonts, layouts, and color schemes.


Hi David, This is an excellent roundup of tools. I just discovered Visualy, and the Google tool (which I had no idea of) looks like just what I need for a project I’ve been struggling with for years.
Anita
David
Thanks for sharing. Have you tired Tagxedo for word clouds? I prefer it to Wordle. You have the ability to use custom shapes and it is easier to save and share the clouds that you create.
Kathy
Excellent list of tools thank you. Liked Wordle in particular, to help people get through wordy web pages
Thanks for great finds. Many Eyes has the perfect US State map for plotting temperatures ideal for certain plants. I think this graphic will instantly convey the data and will look great too. Wish me luck!