During Pubcon Vegas 2015, I had the opportunity to present on infographics and discussed why infographics kick ass, encouraged those in attendance not to compromise on design, presented some tips on how to promote infographics socially, talked about some ways that infographics can be re-purposed and finally showcased three case studies.
While the slide deck from my presentation can be viewed on Slideshare, I thought I’d share a few highlights below.
First of all, unless you’ve been on a very extended vacation from the world, you have no doubt realized that over the last several years we have seen a huge increase in visualized information. Consider the following…

400% Increase in Literature Since 1990

9,900% Increase on the Internet Since 2007

142% Increase in Newspapers Between 1985-1994
Infographics Kick Ass!
In light of these facts, I make the argument that content needs to be visual. Well written textual articles and posts are still great as well as how to guides, bullet lists and white papers but all can be complimented with imagery. And even better, all can be complimented or even replaced with well-designed infographics.
Here are some reasons why infographics kick ass!

People remember:
- 10% of what they hear
- 20% of what they read
- 80% of what they see and do!
So if these facts be true, 8 out of 10 of those who just read those bullet points will forget them. That’s a crazy fact but true all the same. That’s why the statement “Cats Rule the Internet!” will not have a s much impact as a visual of cats actually ruling the Internet.

How many of you reading this post remember these guys…

That’s none other than Kiss in the 80’s, taken at a pinnacle time in their career. The MC who used to announce them in their concerts referenced them as “The Hottest Band in the World…” And they were at the time but not because they were oozing with musical talent (sorry Kiss fans).
The reason why they were so popular was because they put on a hell of a show. The visual aspects of their concerts is really what put them on top – the 40 foot columns of flame, Gene Simmons spitting blood and breathing fire, stage and drum platforms that would rise in the air and so much more.
This is where infographics can kick textual content’s ass!
Types of Infographics
Today’s infographics can currently be grouped into four classes (click on each below for a live example).
Each has its own uses and purpose and obviously as you move from static to other versions, time spent as well as costs to develop will increase. The vast majority of infographics that are being developed and published today is Static but that could change in the near future as there becomes more demand for motion and interactivity.
Ugly Infographics
I have to mention here quickly that to cut corners and put out poorly designed infographics is not worth the time and effort and can actually degrade your reputation and brand.

No Matter How Good the Idea, Poor Design Will Kill the Effectiveness of an Infographic
Sure there are rare occasions where “going cheap” can payoff. Take the movie Napoleon Dynamite for example. Filmed on a $400,000 budget and Jon Hedger, the leader actor only making $1,000 for his role, but in its first year it becomes a cult classic and earns a whopping $45 million! Yes it can happen but it is very rare. So better to invest well in your infographic design and marketing strategy than to take your chances on being cheap.

Social Promotion
Now that we’ve talked about why infographics are great and how they should well designed, equally important is that they be promoted. One of the easiest and most effective ways to promote them is socially.

Here are a few tips to keep in mind when socially sharing your infographics:
- Always link back to original content
- Include a short description
- Utilize #hashtags
- Include images
- Call out influencers
Re-purposing Infographics
There are several ways I have seen infographics re-purposed to give them more reach and shelf life to have impact. Here are four that I talked about in my presentation.
1. Splice and Dice – Consider cropping out sections of you infographic and using them as images in a textual post
2. Convert to Text – Take all of the textual data in your infographic and include it along with the infographic or as a separate post.
3. Convert to Video – Check out this post to see how they took and infographic and made a video out of it as well.
4. Update With New Data – Yearly statistics, seasonal and even politically themed infographics can be updated and re-purposed.
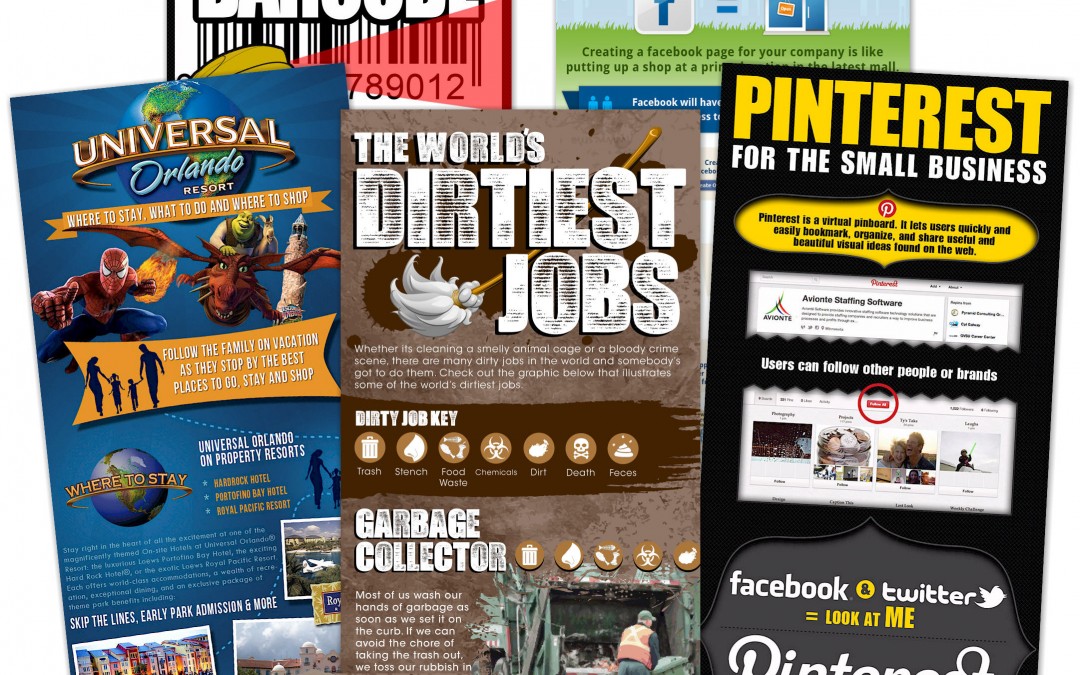
Case Studies
Finally, here are three case studies, all infographics that were published on our infographic archive and then promoted merely by socially sharing to our own networks. Notice that all of them were published a while ago but continue to drive traffic, generate social shares and earn links. The main idea here is that infographics are the “gift that keeps on giving.”


You might also like…


